Introduction
Features
Installation
Usage
Limitations and Bugs
This article describes a Tcl/Tk program which displays the data from the 1 Bit Data Scope on a computer screen. The scope uses two programs, one written in C to process the raw byte stream into low-to-high and high-to-low transitions, and a Tcl/Tk program to provide a configuration panel and a display of the data versus time (like an oscilloscope).
The Tcl/Tk program expects to find the data acquisition program in your search path so you should move the 1bitda program into your /usr/local/bin directory or add its location to your search path. Depending on how you want to invoke the Tcl/Tk program, you may want to change the mode of 1bitds.tcl to 755 and put it in a directory in your search path too.
Test the data acquisition program with the command:
1bitda /dev/ttyS0 57.6
using values appropriate for you serial port and baud rate.
If you do not see a stream of value, duration pairs, check
the permissions on the serial port and verify that the circuit
is attached.
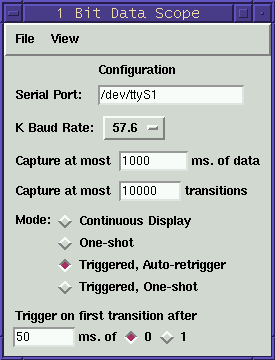
From the "View" pull-down menu select "Configuration" to open the configuration panel.
The configuration panel lets you specify which serial port to use
and its baud rate. You can set the time scale of the data display
in milliseconds and put an upper bound on the number of transitions
to capture. The trigger modes are Continuous, One Shot, Triggered
w/auto-retrigger, and Triggered One Shot. These modes correspond
to their oscilloscope equivalents. The configuration panel lets
you specify the trigger as a duration of a specific logic level.
When you are done with the configuration, select "Data Display"
from the "View" menu to bring up the data display panel.

The "Run" button is a toggle button to start or stop the display
of data. In the modes One-Shot and Triggered One-Shot the "Run"
button becomes "Stop" for the duration of the trace and then
reverts to "Run".
The Scale slider controls the zoom factor of the data captured. The scale varies from 1 to 10 in zoom steps of about 1, 2, 5, 10, 20 up to a zoom of 1000. The slider under the data display lets you select which time period to view when zoomed in.
The time scale on the data display is always in milliseconds. This may be a little awkward at first if you are looking at a trace that last several days.
The "Save" selection in the "File" pull-down menu lets you save your trace data as a file of value-duration pairs. The "Load" selection loads a file of value-duration pairs into the data display.
When zoomed in, the data display will sometimes appear blank. Changing the scale seems to help.
The program does not watch for overrun errors, so the user must
cat /proc/tty/driver/serial to look for errors. Note
that the serial file does not report errors if there are
none. For example:
|
cat /proc/tty/driver/serial serinfo:1.0 driver:5.05c revision:2001-07-08 0: uart:16550A port:3F8 irq:4 tx:0 rx:0 DSR 1: uart:16550A port:2F8 irq:3 baud:57600 tx:0 rx:4851368 fe:61 brk:198 oe:2 RTS|DTR 4: uart:16550A port:A400 irq:5 tx:0 rx:0 5: uart:16550A port:A000 irq:5 tx:0 rx:0 |
Please help the author out by reporting bugs and making suggestions to improve the code. You can reach the author as bsmith at linuxtoys.org.